
Every Network Has a Heartbeat: Introducing ASN Activity Profiles
Get Unlimited Access to IPinfo Lite
Start using accurate IP data for cybersecurity, compliance, and personalization—no limits, no cost.
Sign up for freeEvery autonomous system (AS) has a daily rhythm. A home-broadband network in Italy goes quiet at 3am and roars back at dinnertime. A government office in São Paulo lights up at 8am sharp and flatlines on weekends. A datacenter in Bucharest hums at the same level around the clock.
We now surface that rhythm directly on every ASN page as an activity profile, a weekly heatmap plus a handful of summary signals: peak hour, active hours, weekday-vs-weekend balance, and how geographically spread the network is. It turns a static ownership record into a behavioral fingerprint.
Why an ASN's Rhythm Tells You Something
Most ASN data provides network ownership information: name, type, country, the IP ranges it announces. Useful, but static. What it doesn't tell you is how the network actually behaves.
Behavior is where the interesting signal lives:
- A network whose traffic follows a clean day/night curve in a single timezone is almost certainly eyeball/residential: real users on reliable schedules.
- A network that's dead flat 24/7 is almost certainly infrastructure: hosting, cloud, CDN, machines that don't sleep.
- A network that's busy 9-to-5 on weekdays and silent on weekends is human, but at work: a corporate, government, or office network.
You can't read that off an ownership record. You can read it off an activity profile.
What We Measure
For each ASN we build a normalized weekly heatmap: 7 days × 24 hours, in the network's own local time, showing relative activity in each slot. From that curve we derive a few summary signals:
- Diurnality: How big the swing is between the busiest and quietest hours. ~1 means flat; double digits means a network that essentially sleeps
- Active hours: How many hours a day the network is meaningfully busy
- Weekend/weekday ratio: Below 1 means a network that quiets down on weekends (a tell for office/business traffic); around 1 means it doesn't care what day it is
- Peak hour & busiest day: when the network is at its loudest
- Geography & timezone spread: whether activity points to a single timezone (a real geographic home) or is smeared across the globe (anycast, distributed cloud, no single home)
A quick note on method: this is built from observed activity, normalized per-network, so a tiny ISP and a hyperscaler are directly comparable: the heatmap shows shape, not raw volume.
Five Networks, Five Completely Different Rhythms
The fastest way to understand the feature is to look at real networks. Every number below is live data.
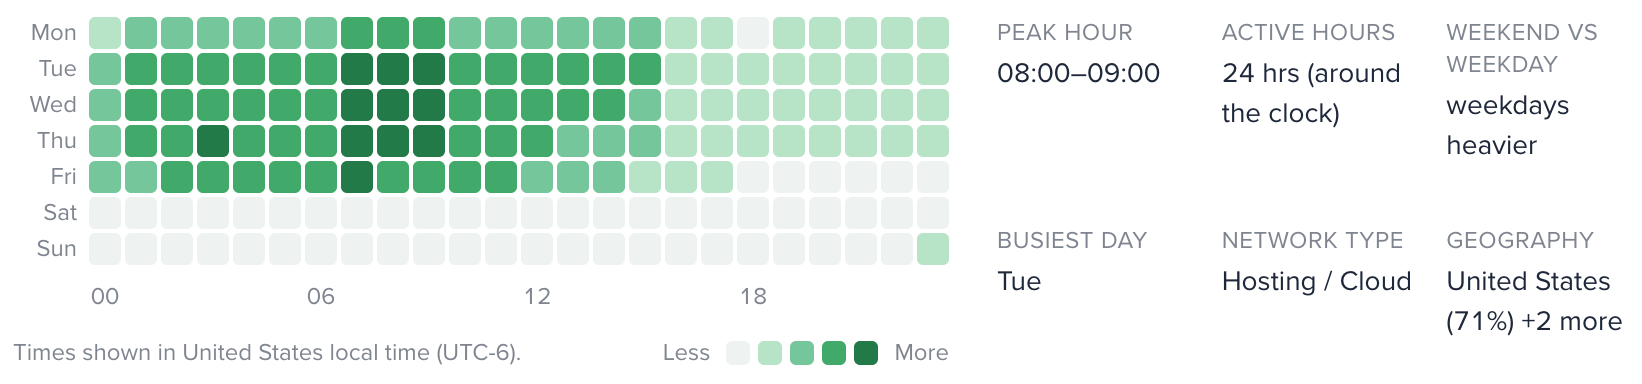
1. The office that clocks out: Prodesp (AS28637)
Prodesp runs IT for the government of São Paulo state. Its profile is one of the most extreme we've seen:
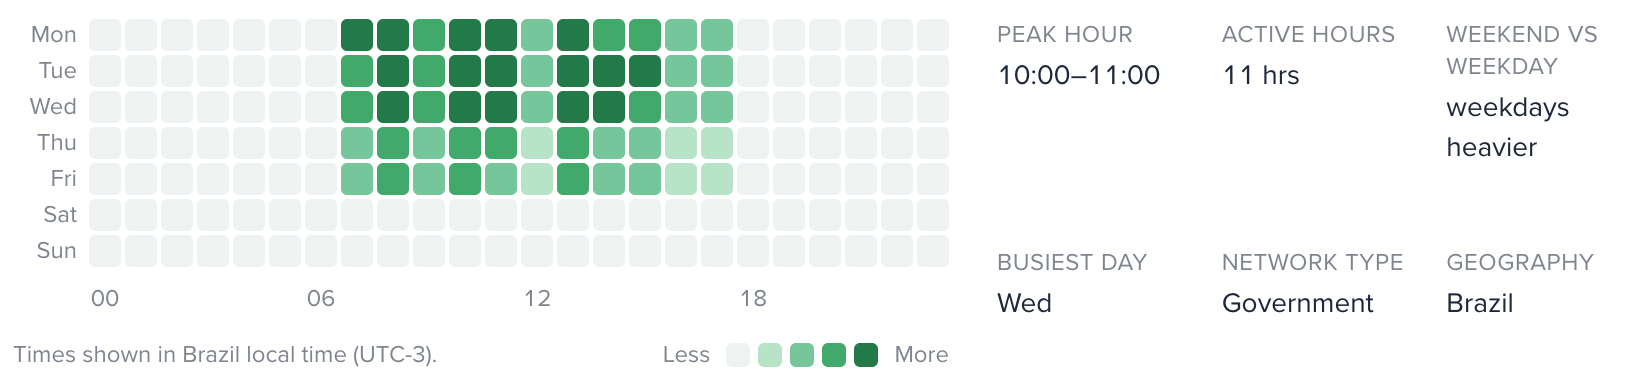
Diurnality: peaks are ~40× the overnight floor
Active hours: 11
Weekend/weekday: 0.01
That 0.01 is not a typo. On weekends the network is, for all practical purposes, off. Activity snaps on at 8am local, runs through the workday, and snaps off in the evening: Monday to Friday only. This is what a building full of people logging into government systems looks like from the network layer.
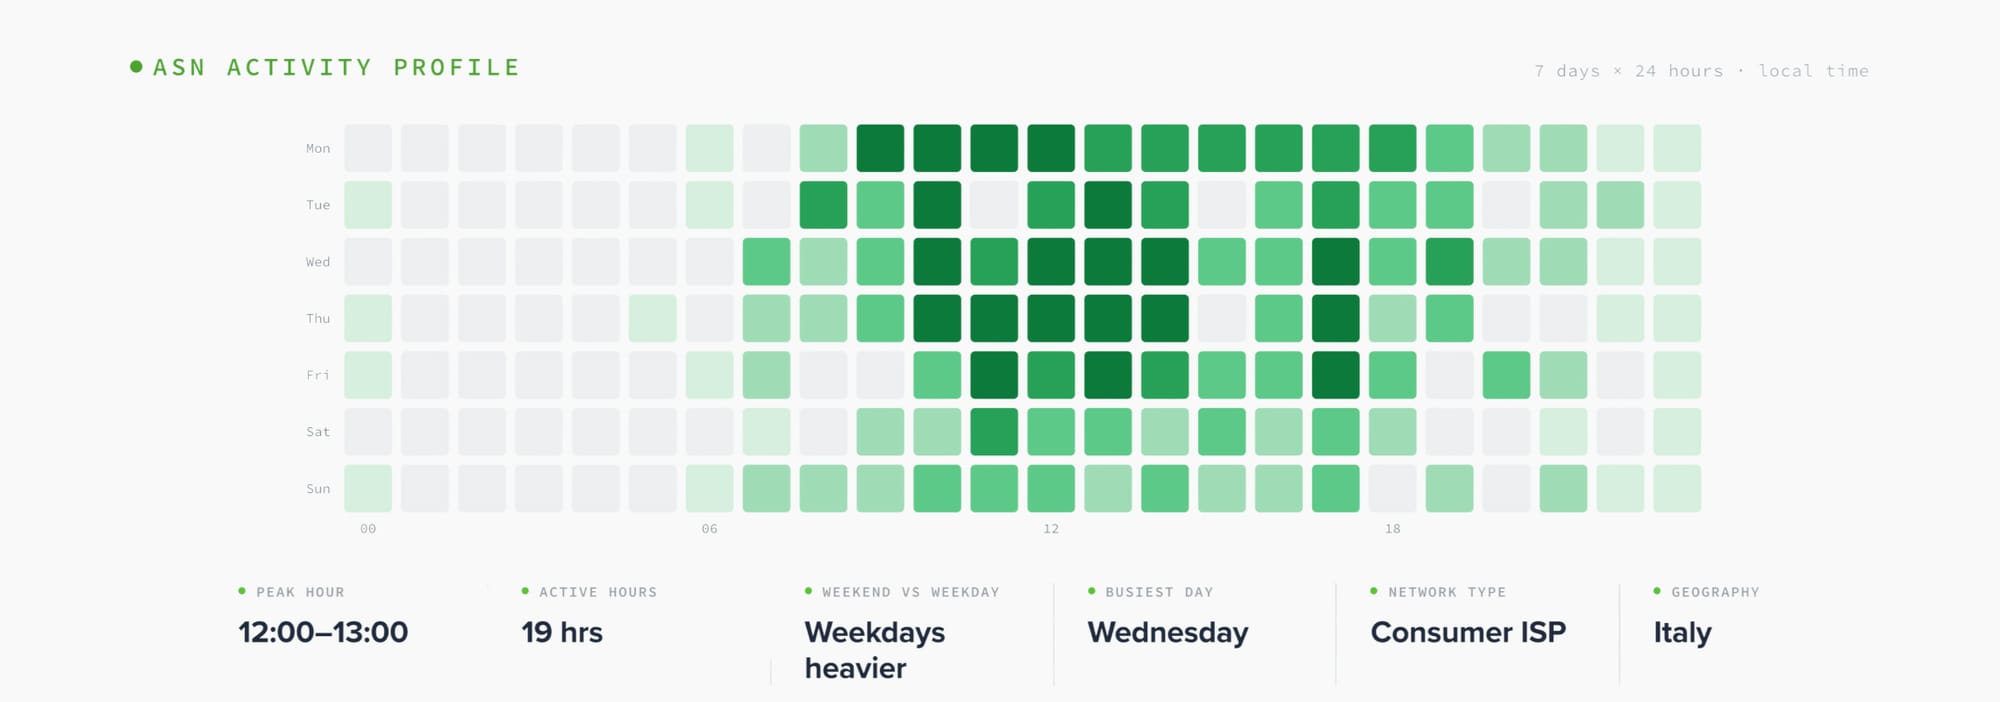
2. The residential wave: Telecom Italia (AS3269)
Telecom Italia is textbook eyeball broadband, and has the strongest day/night swing of any large consumer ISP we measured:
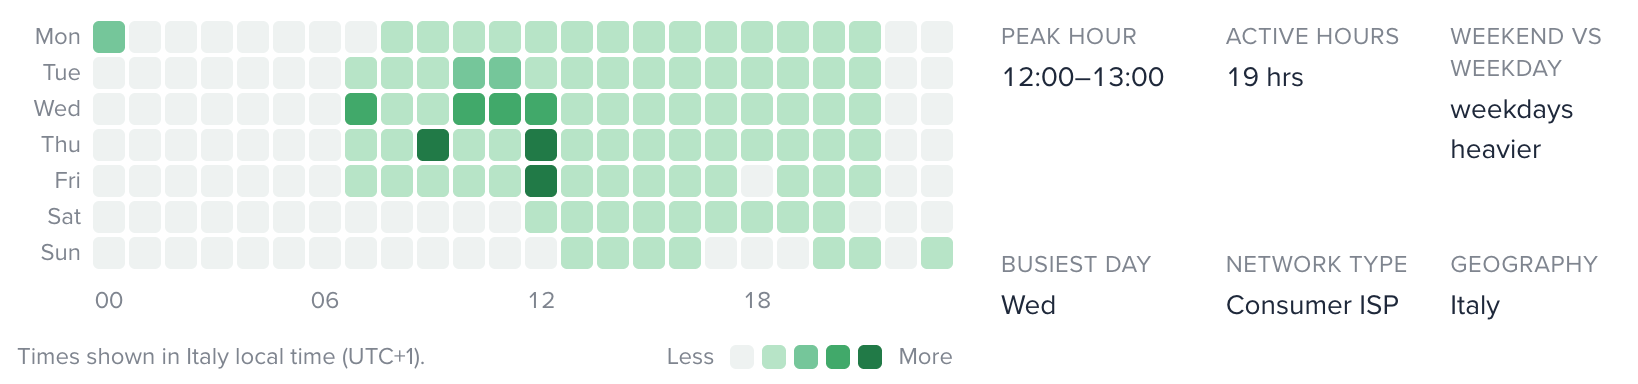
Diurnality: 11.4×
Active hours: 19
Weekend/weekday: 0.7
Activity bottoms out in the small hours, climbs through the morning, and peaks in the evening as people get home, the classic residential "wave." The same shape shows up across consumer ISPs worldwide: Telefónica España (7.0×), MTN Nigeria (6.4×), Reliance Jio in India, and Korea Telecom — the last at 132M observations, proving the curve stays clean even at massive scale.
3. The always-on hum: M247 (AS9009)
M247 is a hosting provider, and it looks nothing like the two above:
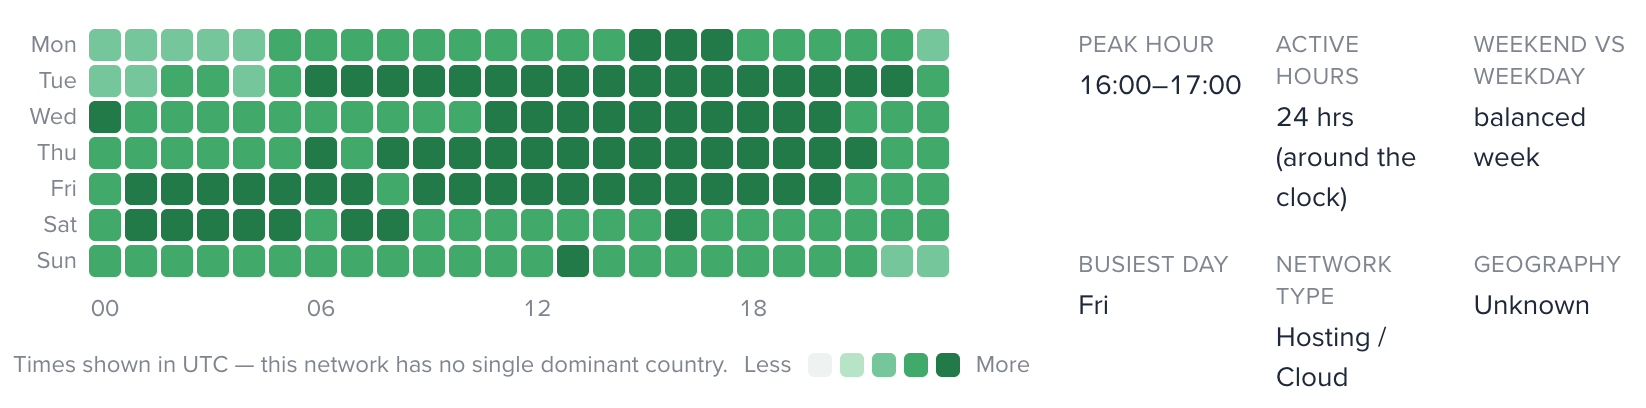
Diurnality: 1.2×
Active hours: 24
No single home country
The heatmap is nearly uniform: every hour, every day, roughly the same. That's the signature of infrastructure: servers, not people. Datacamp (1.2×), Hetzner (1.4×), and Tencent (1.1×, the flattest large network we found) all share this dead-flat fingerprint. When a network has no daily rhythm and no geographic home, you're almost certainly looking at hosting or cloud.
4. The security cloud with a workweek: Bitrise (AS36480)
This one is the most fun, because its rhythm cuts against type. Bitrise is classified as hosting, but its rhythm is human:
Weekend/weekday: 0.14 and collapses on weekends, like an office
Bitrise runs mobile CI/CD build farms. The machines only fire when developers push code and trigger builds, so a datacenter network ends up operating on a human work schedule. The same pattern shows up in corporate security clouds like Zscaler (0.20) and Netskope (0.25), where all the traffic is employees behind the proxy. It's a great reminder that "hosting" doesn't always mean "always-on."
5. The network with no home: China Unicom Backbone (AS4837)
Some networks light up every timezone at once, like in this China backbone example:
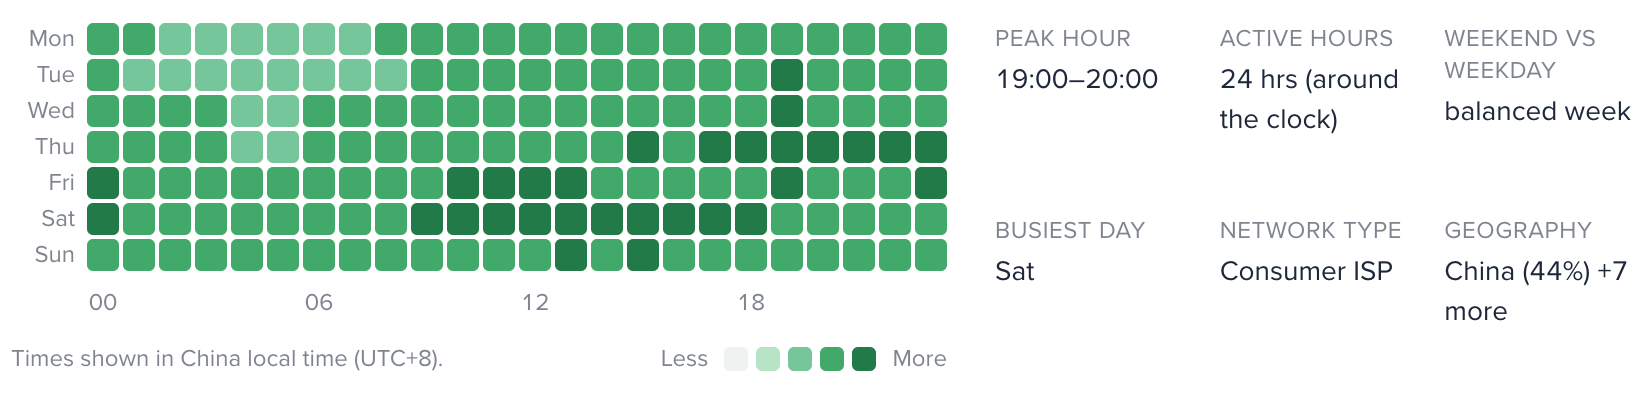
Timezone entropy: 1.8 (very high)
Diurnality: 1.3× (flat)
When activity is both flat and spread across every timezone, no single geography "wins": the profile correctly reports no dominant home. Global backbones like China Unicom and Chinanet, and global clouds like Google and AWS, all land here. This is exactly the case where a single "country" field for an ASN would mislead and where the timezone spread tells the real story.
How to Read a Profile in Three Seconds
A quick rule-of-thumb for eyeballing a profile (not how we classify ASNs under the hood):
These are reading aids, not classification rules. An ASN's type takes a range of signals into account, and an activity profile is one lens on network behavior, not a hard cutoff.
Where to Find Them
Activity profiles are live on every ASN page on IPinfo, free for everyone: no login, no plan required. Try AS3269 and compare it to AS9009 to see the contrast for yourself.
Want this data in your own systems to enrich logs, score traffic, or build it into your own products? The underlying activity signals are available for ingestion at scale. Talk to our sales team about getting access.
Share this article
About the authors

Ben Dowling is Co-CEO and founder of IPinfo. Since founding the company in 2013, he has helped shape the IP intelligence industry by making accurate, verified internet data more accessible to organizations worldwide.

As the product marketing manager, Fernanda helps customers better understand how IPinfo products can serve their needs.